9. Debug Rendering
Debug rendering is a way to visually inspect the state of the underlying AGX Dynamics Simulation during runtime. AGX Dynamics for Unreal offers few different debug rendering tools:
Web Debugger - shows AGX debug rendering information in the browser in a 3D-view.
Draw Shape Contacts - draw Shape contact points in the viewport in Unreal Engine.
Remote Debugger - allows the default viewer in AGX
AGXViewerto connect to a Simulation running in AGX Dynamics for Unreal and display its debug rendering information.
The subsections below outlines how to use each of these tools.
9.1. Web Debugger
Note
The Web Debugger is currently only supported on Windows.
To start the Web Debugger during Play, in the AGX top menu, select the Toggle Web Debugger option.
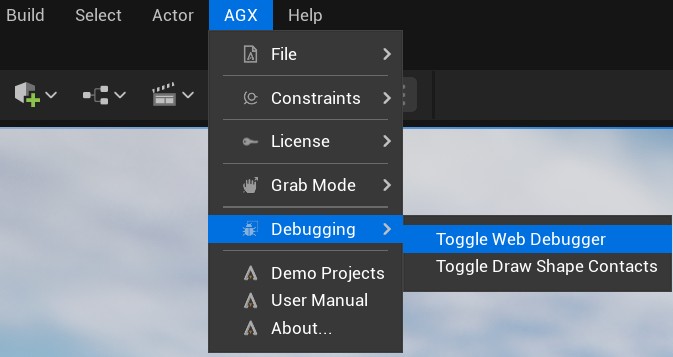
Toggle the Web Debugger from the AGX top menu.
This will start the Web Debugger and automatically open a web browser window where the 3D view is displayed.
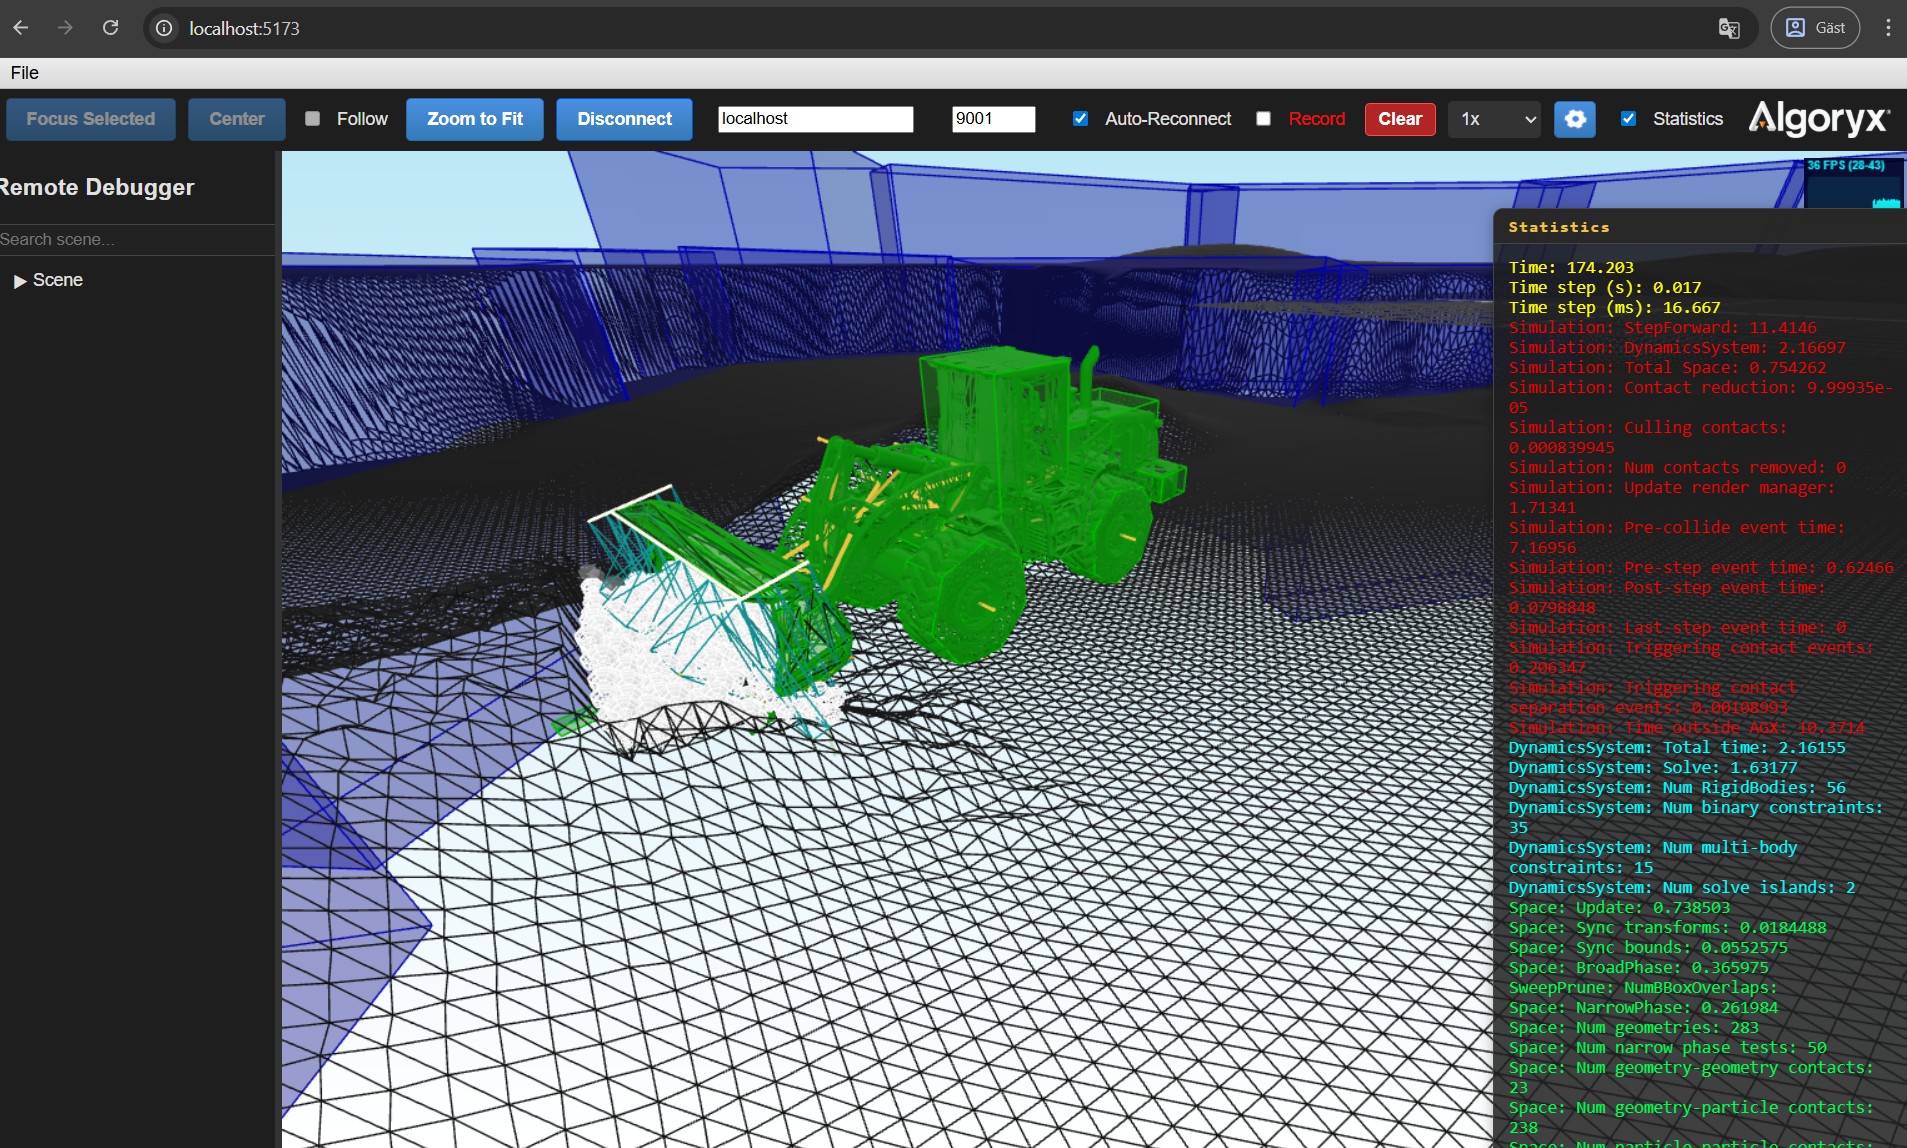
Web Debugger view in web browser.
The Web Debugger consists of two parts: a web server and a web debugger interface (client).
To specify the port number used by the web server and web debugger interface (client), select Edit > Project Settings... > Plugins > AGX Dynamics and look under the Debug category.
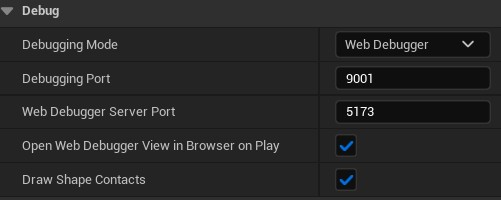
Web Debugger settings in project settings.
By selecting Web Debugger as the Debugging Mode, the Web Debugger will always be started when a Simulation is started.
The Web Debugger view will automatically open in a browser on Play. To turn off this behavior, disable the option Open Web Debugger View in Browser on Play.
The Web Debugger can be started from the AGX top menu even if the Debugging Mode is set to None, and it will use the Port values specified in the Plugin Settings.
The Web Debugger can also be started from Blueprint (or C++), meaning it can be used in cooked (stand-alone) builds.

Enabling Web Debugger from Blueprint.
9.2. Draw Shape Contacts
To enable the Draw Shape Contacts feature, select the Toggle Draw Shape Contacts option from the AGX top menu during Play.
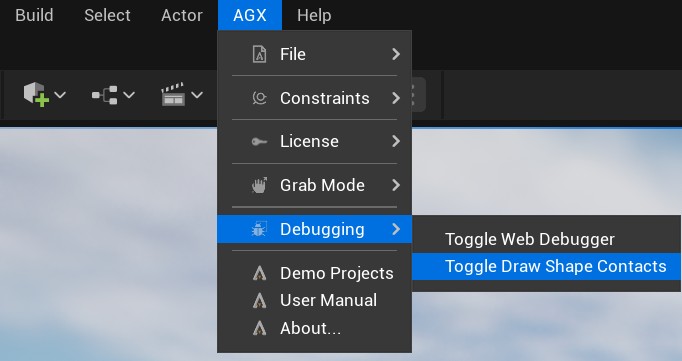
Toggle Draw Shape Contacts from AGX top menu.
When enabled, this will draw Shape Contacts as small orange spheres in the Viewport:
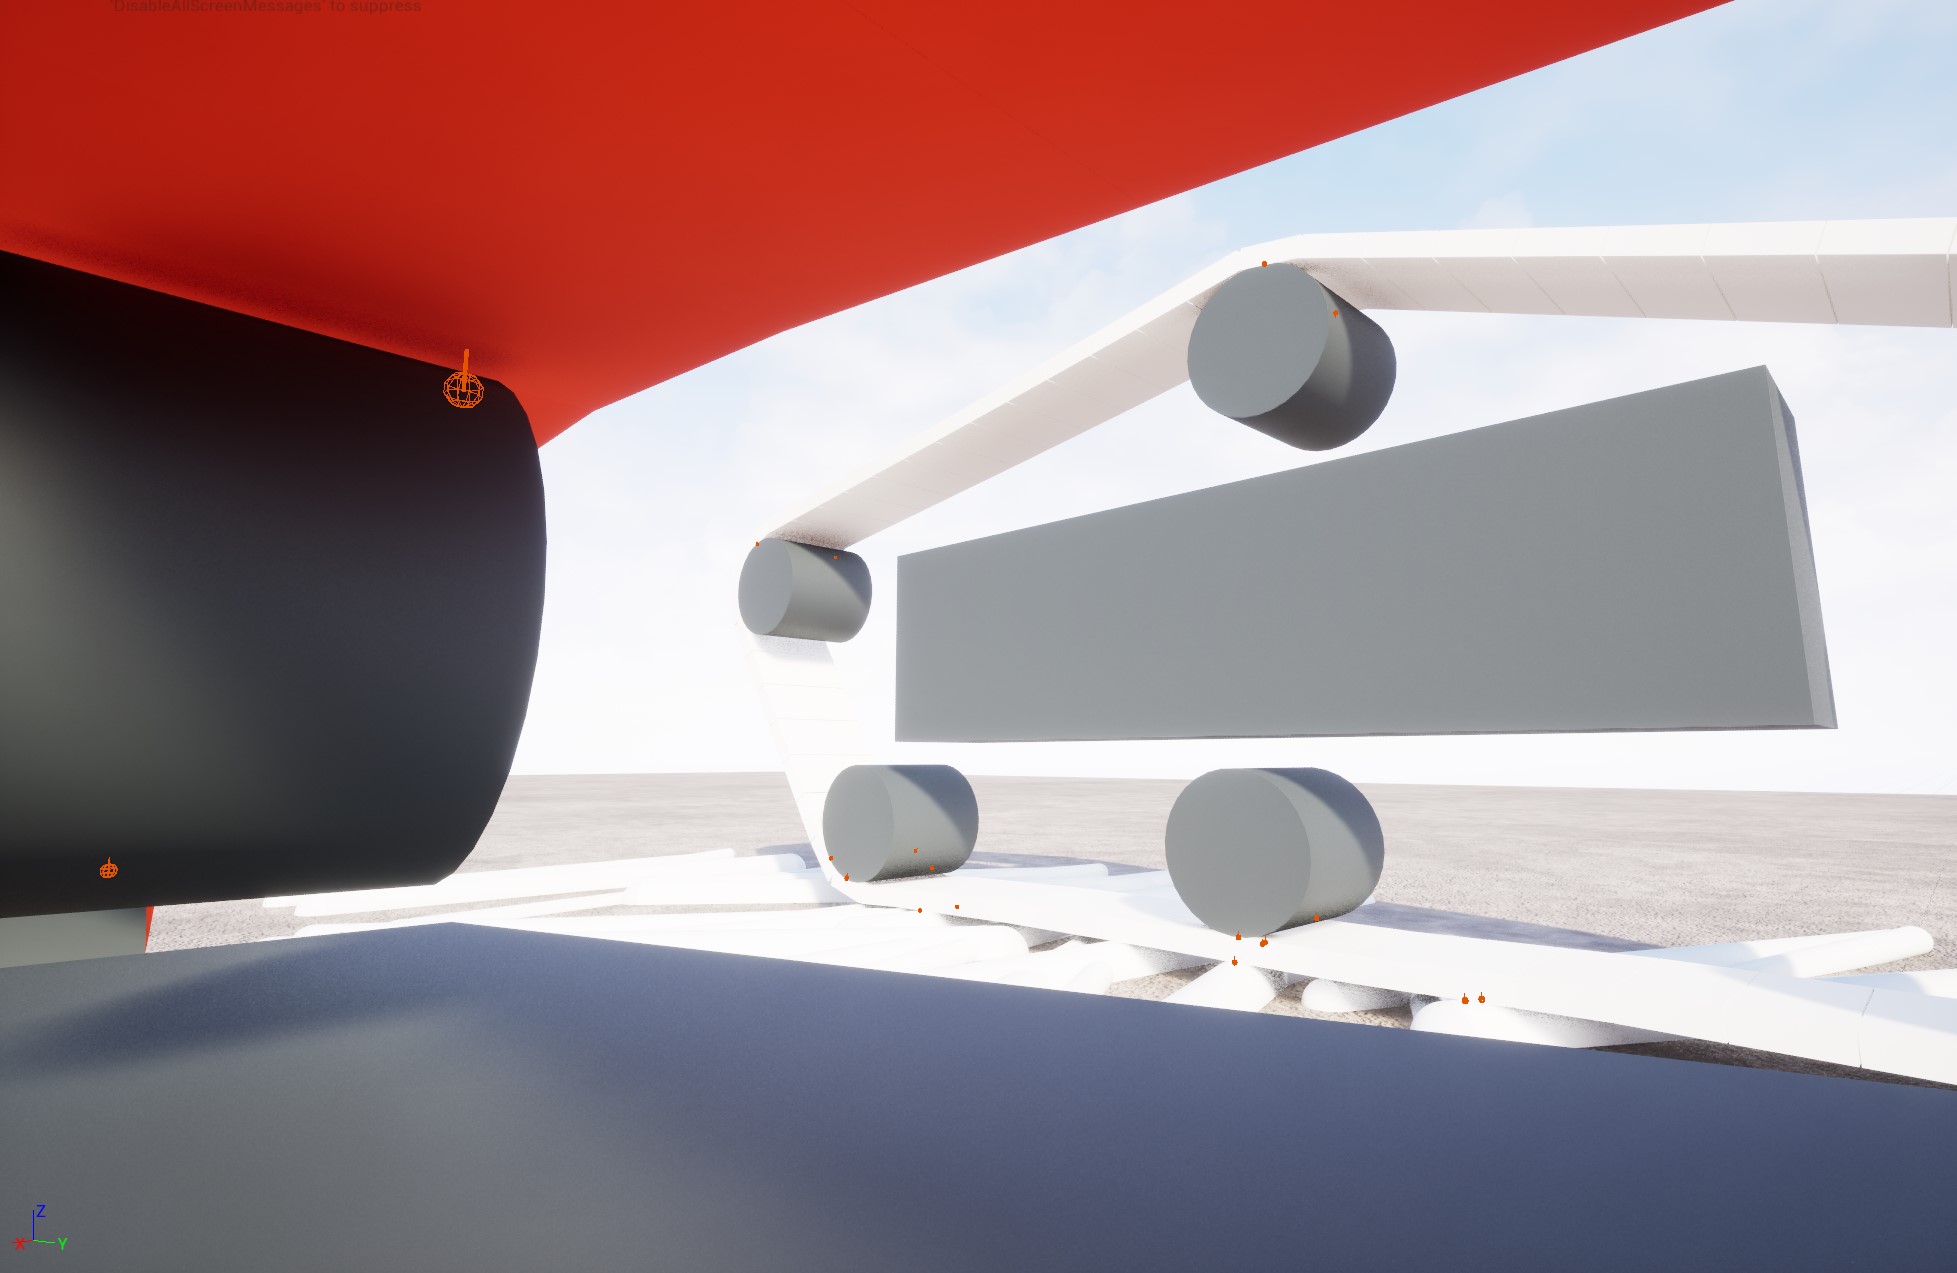
Contacts beeing rendered to the screen.
If enabled in the Project Settings, this will always be enabled during Play.
This option can also be enabled or disabled from Edit > Project Settings... > Plugins > AGX Dynamics under the Debug category:
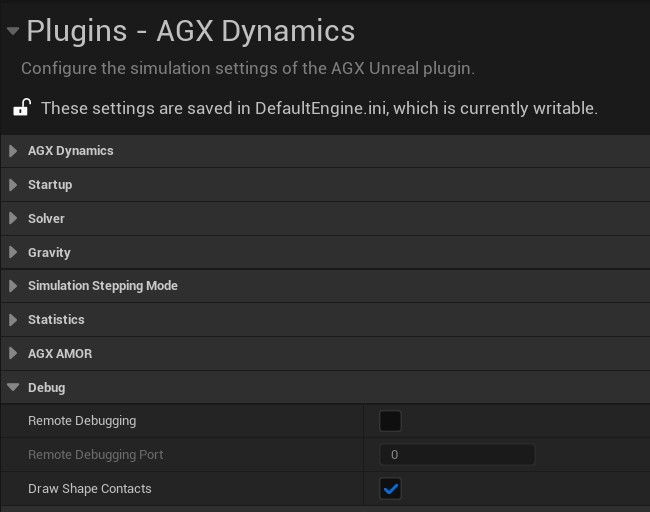
Enabling the Draw Shape Contacts setting.
If enabled in the Project Settings, this will always be enabled during Play.
The Draw Shape Contacts setting can also be enabled or disabled at runtime by setting it in the AGX Simulation object:
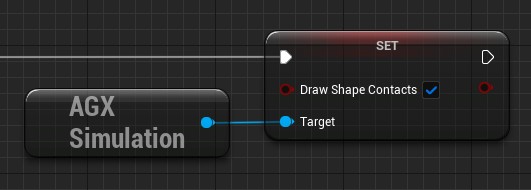
Enabling the Draw Shape Contacts setting at runtime.
Note
The contact point rendering is mainly a debugging and inspection tool and is not avaiable in built applications built with Shipping configuration.
Draw Shape Contacts is computationally intensive, meaning it should be turned off whenever performance is important.
9.3. Remote Debugger
Note
Remote Debugger requires a separate installation of AGX Dynamics, since it requires AGXViewer.
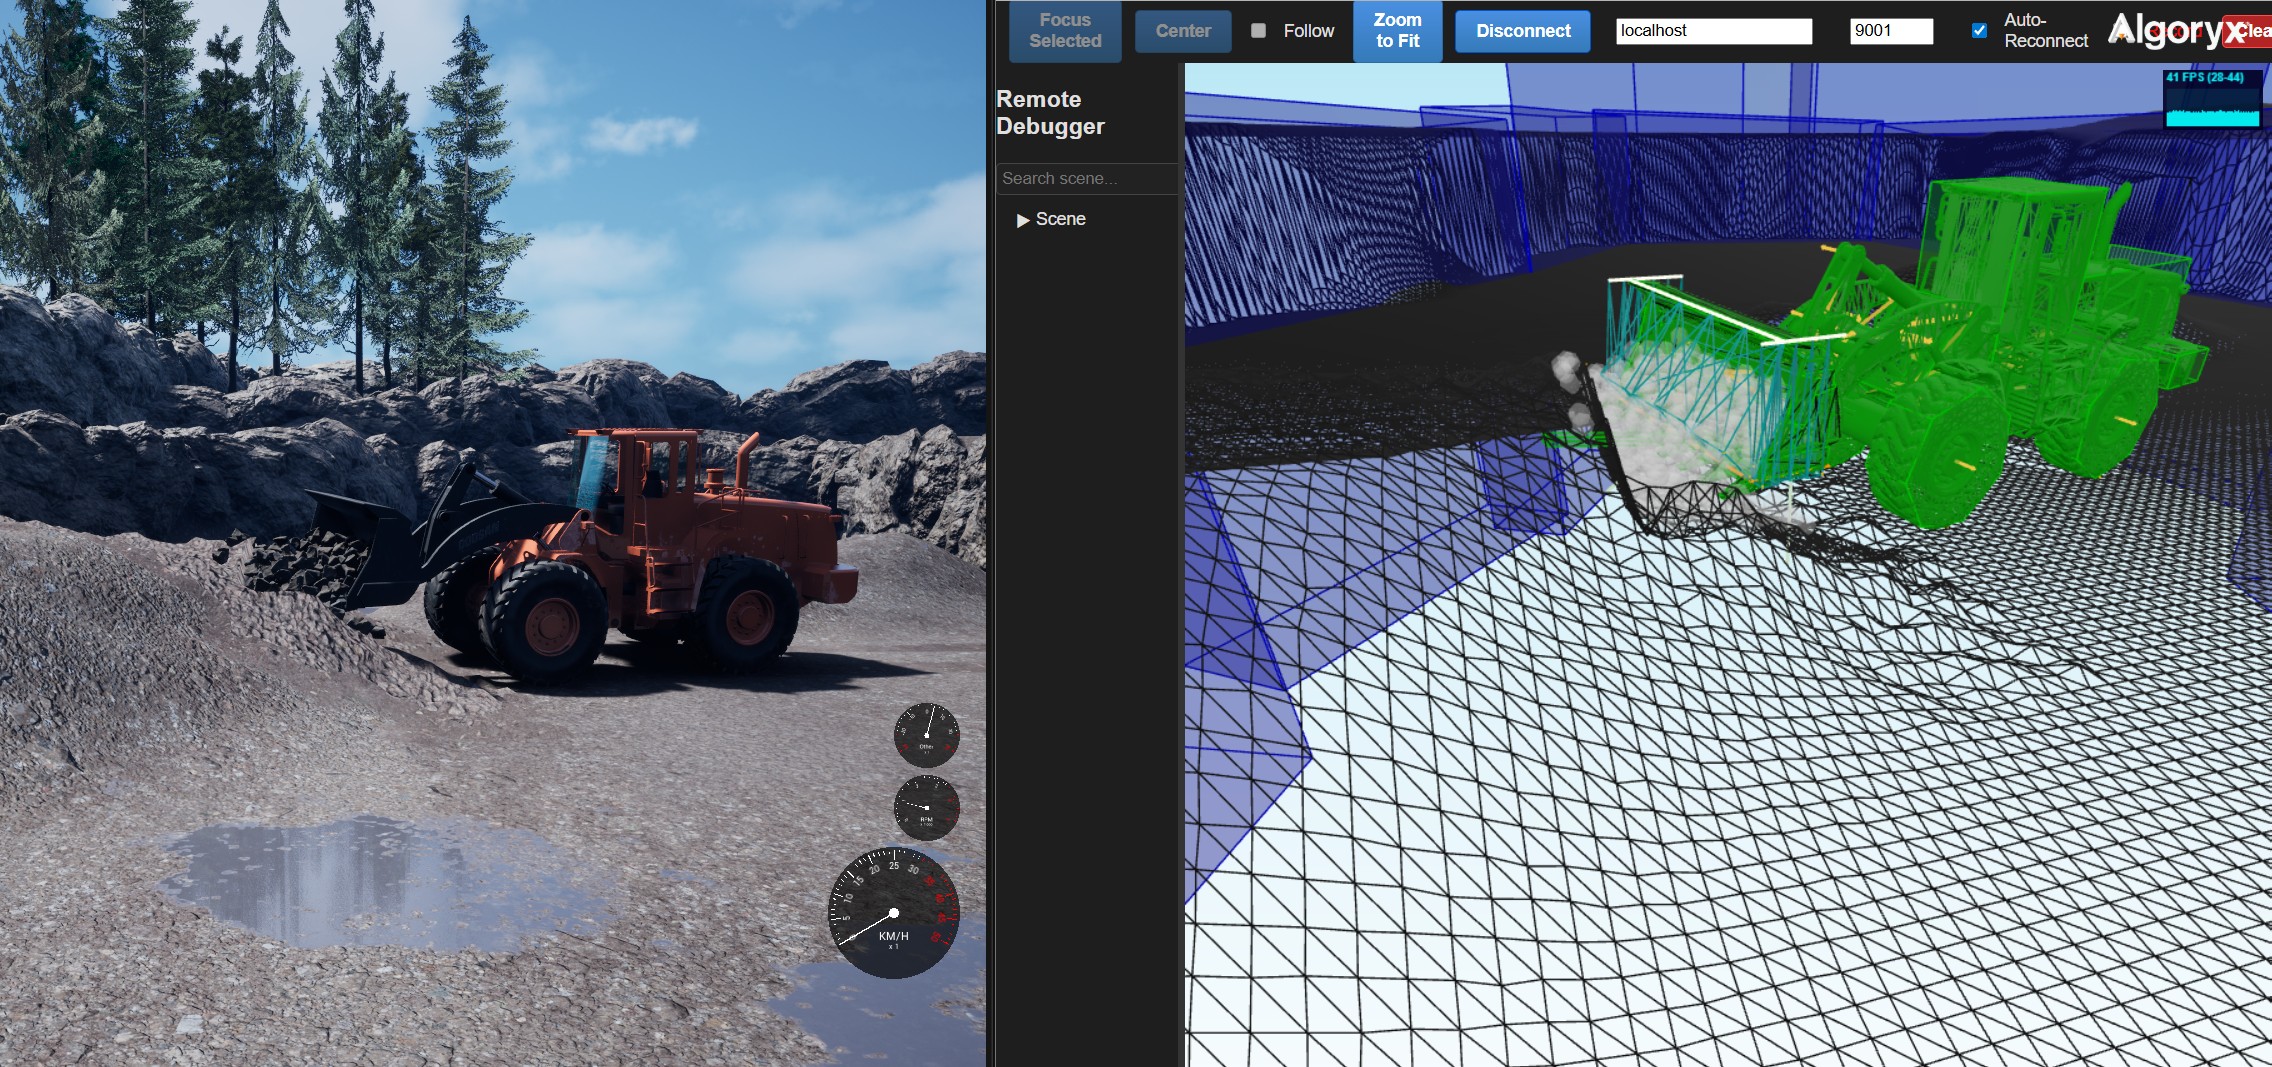
Remote debugging is a way to let an instance of AGXViewer, the default viewer of AGX Dynamics, connect to a Simulation running in AGX Dynamics for Unreal and display its render information.
To enable Remote debugging, select Edit > Project Settings... > Plugins > AGX Dynamics, and under the Debug category, set the Debugging Mode to Remote Debugger:

Enabling the Remote Debugger setting.
From there, the port number can also be changed, as can be seen in the image above.
To connect to the Simulation running in AGX Dynamics for Unreal, start AGXViewer with the following command:
agxViewer -p --connect localhost:``<PORT>``
Where <PORT> should be replaced by the port number set in the Project Settings.